An early question that motivated the design of my steam_data_science python repository was trying to answer “how much do I really like this game?” The idea originally started because a lot of previous analyses I’ve done always relied on just raw user playtime data to do stuff. The problem is: a lot of my data is heavily skewed towards a few games. I used to spend a ton of time playing Planetside 2 and Counter-Strike, but does that really mean I like those games or do I just like them about average compared to the rest of the people that play them? Is my play time of 811 hours a lot in context?
In theory most games have most players centered around some distribution. My original thought was some kind of normal distribution centered around the median playtime. This further motivates: is my Planetside 2 gameplay time above or below that median?
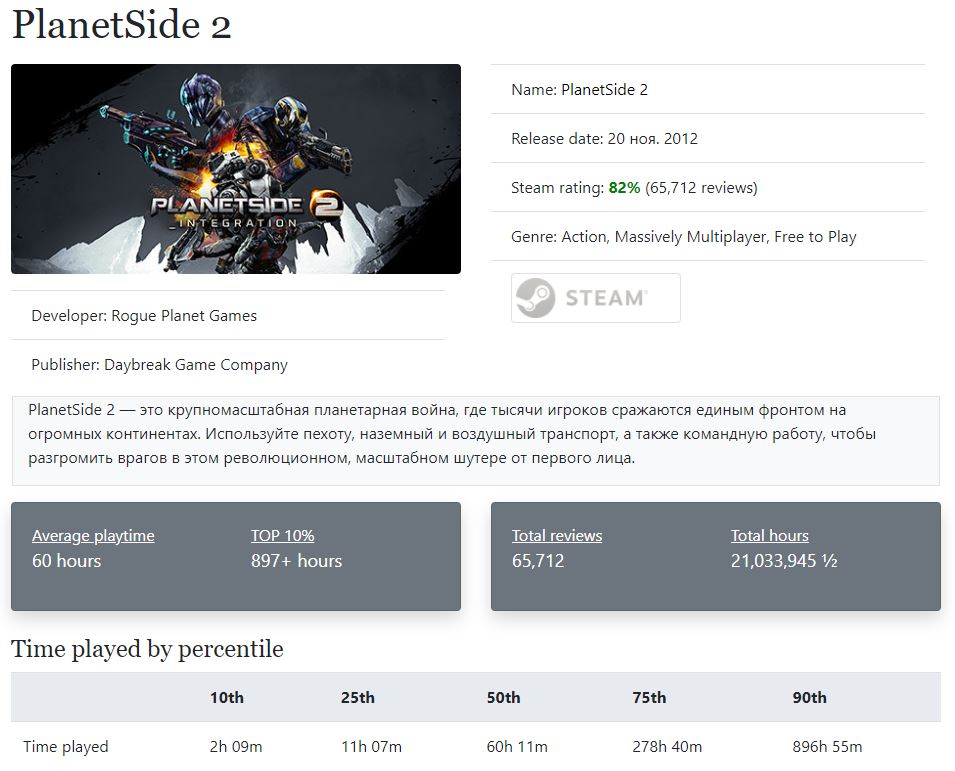
As we can see from Planetside 2’s data, it’s got a long tail of data. If you have 896+ hours of gaming time in PS2, then you’re up in the 90th percentile. Talk about dedicated! So how do we visualize this?
Because we don’t have access to the raw aggregation data from howlongis.io, we can’t build the histogram that we’d normally expect to see a distribution on. The best we can do at the moment is plotting the percentiles vs hours curve. So where would I fit on that line at 811 hours?
To figure that out we need a curve to fit the data, then solve the equation of the curve for the value we want. Easy right? Well what curve do we pick? User engagement time only increases with percentile value, so the ‘flattest’ a curve could be here would be linear. Narrative story games like Soma or What Remains of Edith Finch are amazing experiences, but don’t really expect the users to have a very long lifetime engagement with them, so they’re flatter than something like Planetside or Counter-Strike.

From these equation fits we’re trying to get at the reshaped equation for the percentile for a given playtime value, or
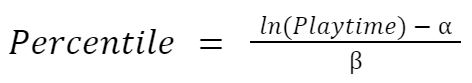
This will let us figure out a user’s percentile value given their total playtime.
Engagement vs Enjoyment
There’s a compelling case to be made that just because someone spent a long time with something doesn’t mean they enjoyed every minute of it. The value of percentile we’re calculating is a measure of engagement compared to the rest of the population and not really a ‘review’ of the game, but it could be correlated to one. I would hope that engagement is correlated to enjoyment to a reasonable extent, especially for games. If you’re not having fun, why continue? There’s a lot of asterisks and caveats to that, which are probably outside the scope here. The main purpose of leveraging the playtime data is to capture a measurable of enjoyment without relying on explicit review data that most people don’t leave anyway.
Building the User Profile
My steam_data_science package has some functionality under the hood to do all this processing. In just a few lines we can get all that juicy engagement data:
api_key = '443E...A4B'
steam_ids_list = ['76561197969025704']
user1 = build_user_profile(api_key, steam_ids_list)
From which we can get all the great data exposed in a dataframe
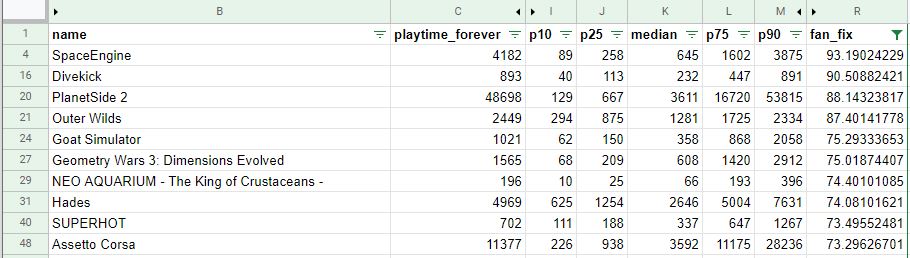
This cracks open a whole case of interesting follow-up questions:
- What’s a user’s most engaging indie game?
- What combination of tags generates the highest predicted engagement value?
- Given two or more users, what games should they play next to maximize that engagement?
- What’s the most engaging title a user has played that is the most poorly reviewed?
- Can/should engagement be negative given the curve fitting approach we’ve designed?
- Etc???
For the sake of keeping this blog post short(ish) and sweet, I’ll try to follow up those questions in future analyses.
Header image by Golgom on the Steam community page for Neo Aquarium – King of Crustaceans.
